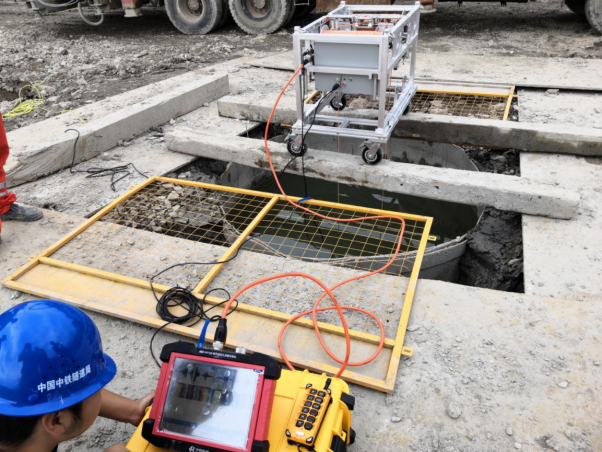
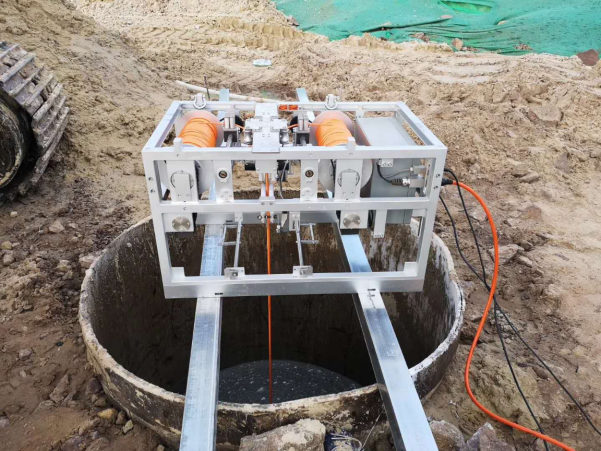
The ultrasonic drilling hole (slot) quality test shall be conducted immediately after the drilling hole has finished cleaning and the bubbles in the slurry of drilling hole have basically dissipated. If the hole is not cleaned, there will be too many suspended matters in the slurry and they will affect the measurement accuracy; if there are bubbles, the ultrasonic wave in the slurry will be reflected too early during transmission; if the retention time is extended after cleaning of the drilling hole, it will increase the risk of hole collapse. During the test, the ultrasonic probe shall be aligned with the center of pile casing. The test is usually conducted only in two directions of x-x’ and y-y’.
Through the ultrasonic drilling hole (slot) quality test, we can obtain the transmission time of the wave reflected from the ultrasonic hole wall, and in light of the ultrasonic distance measurement principle, we can calculate the distance from the ultrasonic probe to the hole wall, and according to this distance, determine the position of hole center, aperture size, and verticality, which can provide guidance for us to judge whether the drilling hole conforms to the requirements of specifications.
The ultrasonic drilling hole (slot) acquisition software is the analysis program of RSM-HGT(B) ultrasonic drilling monitor, and it is mainly used in on-site processing of collected data on drilling hole (slot), and can generate the test report on site. This software can also directly used in windows to process and analyze the collected data. HGT_SBL software has the advantages of simple to operate, powerful functions, and friendly interface.
Features of HGT_SBL software:
- Obvious effect in suppressing the noises in the near field of slurry
- Realize automatic intelligent tracking for the line of the hole wall
- Provide multiple auxiliary lines, thus convenient for reading the waveform and wave train information.
- Intelligently evaluate the drilling hole quality according to the data and information of measured hole
- Automatically generate the drilling hole quality report according to the needs of the site, convenient to print the test report.
Data Processing Flow
The data processing flow is mainly divided into six steps:
Step I: Automatic tracking
Click [1 Automatic / tracking] button to enter the automatic tracking mode, click the point in which the wave reflected from the hole wall is strong, and automatically and intelligently track the line of the hole wall.
Step II: Manual tracking
Click [2 Manual / tracking] button to enter the manual tracking mode, draw the line of the hole wall, and finely adjust the automatically tracked line of the hoe wall.
Step III: Noise suppression
Click [3 Noise / suppression] button to enter the processing of suppressing the noise in the near field of slurry, then suppress the disturbing wave in the near field of slurry, and highlight the reflected wave from the hole wall.
Step IV: Waveform enhancement
Click [4 Waveform / enhancement] button to enter the processing of waveform enhancement, extract the energy envelope of the reflected wave, and highlight the information of the line of hole wall.
Step V: Calculation and analysis
Click [5 Calculation / Analysis] button to enter the calculation and analysis processing, to automatically calculate the average aperture, maximum aperture, minimum aperture and verticality, and intelligently judge the defective section of drilling hole (slot).
Step VI: Save
Step VI: Save
Click [Save] button to enter the file saving mode, automatically save the processing data, calculate and analyze the parameters, and generate the PDF-version drilling hole (slot) quality test image report.
I. Automatic Tracking
Click [1 Automatic / tracking] button to enter the automatic tracking mode. Select the consecutive points (the points close to the bottom of hole are preferred) on which the reflected wave from the hole wall is strong on the image, and the automatic and intelligent tracking of the line of hole wall can be finished. For the section of which the local tracking effect is not ideal, it can be modified through manual tracking.
After entering the analysis software, automatically read *.AQO file, generate the ultrasonic drilling hole image, and the following description takes 13-0-2.AQO file as an example.
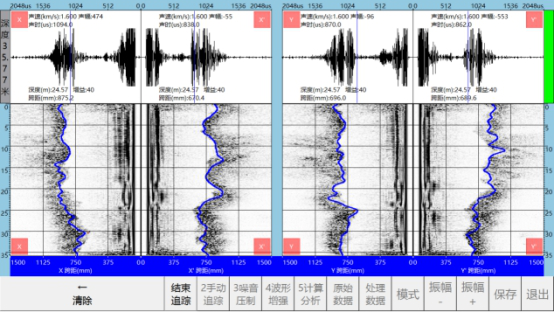 Figure 5-12 Automatic Tracking Mode
After entering [1 Automatic / tracking] mode, the program will automatically shield the operation-unrelated buttons to prevent the operators from operating falsely. After finishing tracking, click [End / tracking] button to exit the automatic tracking mode.
II. Manual Tracking
Click [2 Manual / tracking] to enter the manual tracking mode. Select the section of which the automatic tracking effect is not obvious, manually draw the line of hole wall, click [End / tracking] and the manual tracking of the line of hole wall is finished.
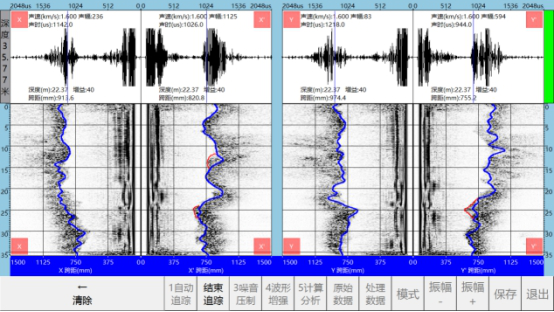 Figure 5-13 Manual Tracking Mode
The red lines in Figure 3-2 are the parts which are modified through manual tracking. If you do not satisfy with the modification, click [Clear] button and the latest red line will be cleared; press and hold [Clear] button and all manually drawn red lines will be cleared.
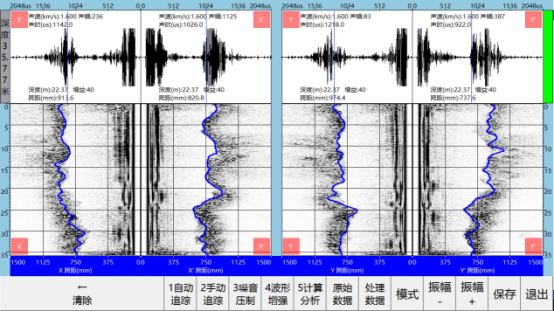 Figure 5-14 Manual Tracking
III. Noise Suppression
Click [3 Noise / suppression] button to suppress the near-field slurry noise in the collected data; it is advised to conduct noise suppression for 2~3 times and after that, near-field interference of slurry can be effectively suppressed, and the reflection echo signal of the hole wall can be highlighted.
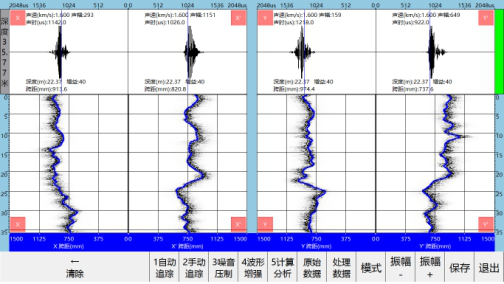 Figure 5-15 Noise Suppression
I. Waveform Enhancement
Click [4 Waveform / enhancement] button to enter the waveform enhancement processing; when enhancing the waveform, extract the energy envelope of reflected wave, which can further enhance the display information of the hole wall.
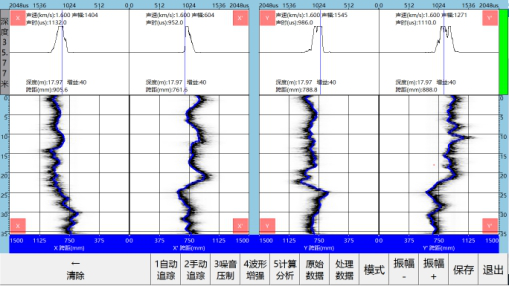 Figure 5-16 Waveform Enhancement
II. Calculation and Analysis
Click [5 Calculation / analysis] button to enter the drilling hole quality calculation and analysis dialog box, as shown in Figure 3-6 below.
First select drilling hole test or slot test according to the test object; then click Apply button, and according to the pick-up time of the line of hole wall, calculate the average aperture, maximum aperture, minimum aperture, eccentric distance and verticality of drilling hole, and make scientific and systematic evaluation for the drilling hole quality, as shown in Figure 3-7 Test Result.
According to the speed of sonic wave in the slurry collected on site, appropriately adjust the speed of sonic sound in the slurry, then click Apply button and the aperture value can be modified. For the line of hole wall, smoothing and translation processing can be made for it appropriately so as to make the line of hole wall more smooth and closer to the reality.
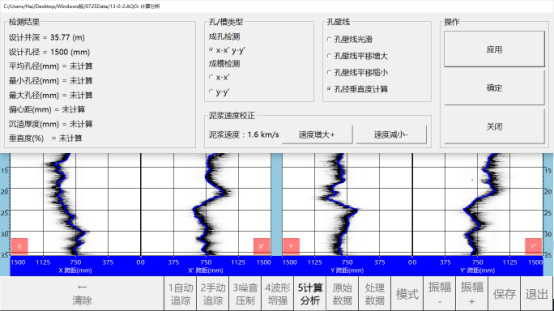 Figure 5-17 Initial Dialog Box of Calculation and Analysis
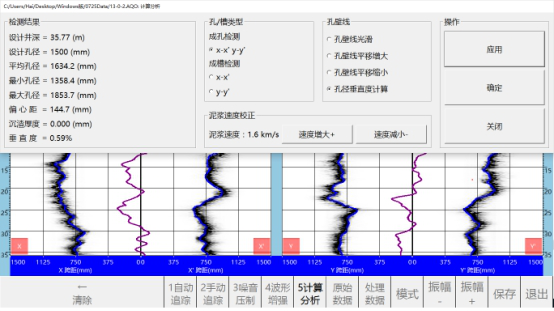 Figure 5-18 Dialog Box of Calculation and Analysis Result
IIII. Save
Click [Save] button and the prompt window will pop up. HGT_SBL software can intelligently save the file and generate the drilling hole quality test image report according to the user’s behavior. There are the following two circumstances.
Circumstance 1: calculation and analysis has been conducted
If the drilling hole quality has been calculated and analyzed, save the following files:
(1) S***.AQO file: The processed ultrasonic drilling hole quality test data file, with the format identical with that of the original collected data.
(2) S***.AQD: The ultrasonic drilling hole quality test data file including the information such as verticality, with the format different from that of the original collected data.
(3) S***.PDF: The PDF file of ultrasonic drilling hole quality test image.
*** represents the name of the original data file.
If the drilling hole quality has been calculated and analyzed, the save dialog box is as shown in Figure 3-8;
Circumstance 2: calculation and analysis has not been conducted
If the drilling hole quality has not been calculated and analyzed, save the following files:
(1) S***.AQO file: The processed ultrasonic drilling hole quality test data file, with the format identical with that of the original collected data.
(2) S***.PDF: The PDF file of ultrasonic drilling hole quality test image.
*** represents the name of the original data file. The display information dialog box is as shown in Figure 3-8;
If the drilling hole quality has not been calculated and analyzed, the save dialog box is as shown in Figure 3-9.
In the process of saving the files, the dialog box will display the saving progress and the saving time and path, as shown in Figure 3-10.
Remarks:
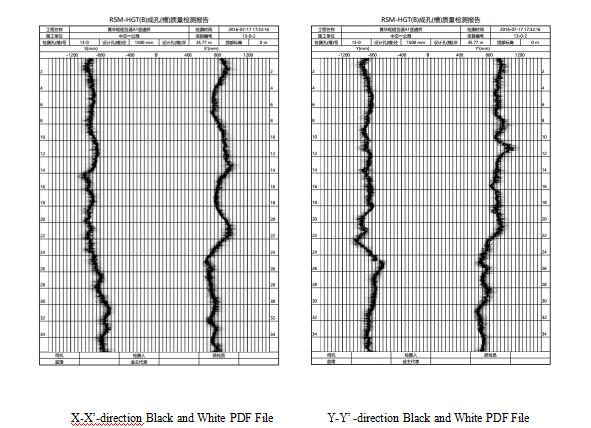
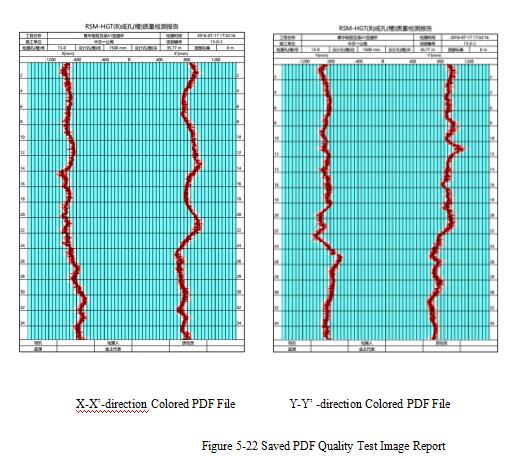
(1) There are four PDF files, among which, S***.PDF is colored image of X-X’ profile, S***+2.PDF is colored image of Y-Y’ profile, S***BW.PDF is black and white image of X-X’ profile, and S***BW+2.PDF is black and white image of Y-Y’ profile.
(2) If the current color code is black and white, the content of S***.PDF and S***BW.PDF is the same, and the content of S***+2.PDF and S***BW+2.PDF is the same.
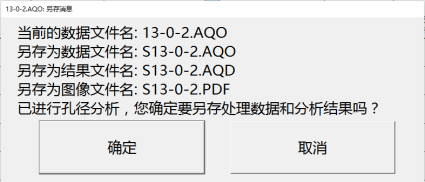 Figure 5-19 Dialog Box of Saving Files after Calculation and Analysis Has Been Conducted
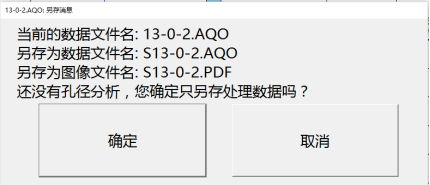 Figure 5-20 Dialog Box of Saving Files if Calculation and Analysis Has Not Been Conducted
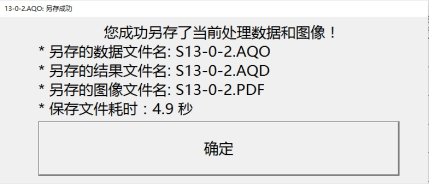 Figure 5-21 Dialog Box that Files Have Been Saved Successfully
Note for naming of the saved files: the file with the suffix of .*AQO is the format of the original data file, the file with the suffix of .*AQD is the format of processed data file, and the file name is added with the prefix S for distinguishing; the generated drilling hole test report PDF file has two types, one is the colored file based on the color selected by user, and the other is black and white file, and the file name is added with the suffix BW for distinguishing. The paper size of all files is A4.


