F, ZV curve - the time-history curve of the force and velocity of the pile section at the installation position of the sensor.
Information contained in the force and velocity time-history curves:
1. The quality of data collected and test results;
2. Whether the F, ZV curve returns to zero reflects the working state of the sensor and the instrument system;
3. Shock incident wave;
4. The distribution of soil resistance, judge the bearing condition of the pile, and check the velocity when there is reflection at the bottom of the pile;
5. Pile body integrity evaluation.
Up and down wave curve - the time history curve of the up and down wave passing through the sensor installation.
The up and down wave curves contain the following information:
1. The downward wave curve reflects the relationship between hammer force and time (only 0 2. The upward wave curve reflects the distribution of soil resistance on the pile side (including static resistance and dynamic resistance) (only in the period of 0 3. The average velocity can be calculated through the upward and downward wave curves.
Energy and displacement curve—the energy and displacement time-history curve of the pile section where the sensor is installed.
The energy, displacement curve contains the following information:
1. The peak value in the energy curve is the maximum transfer energy value.
2. The peak value in the displacement curve is the maximum displacement of the pile body.
3. The final stable value in the displacement curve is the final dynamic displacement of the pile relative to the soil, which can sometimes be regarded as the penetration of the pile body.
4. Whether the displacement curve converges with respect to the time axis can reflect the working state of the accelerometer.
The following takes the data analysis of the RSM-PDT high strain pile bearing tester as an example to explain how to use the analysis software to analyze the tested data and output a report.
Click to download CASE analysis software.
Click to download high strain PDA typical data.
CASE analysis software operation steps
1. Open the RSM high-strain CASE analysis software, click File, and open the waveform file. As shown below.
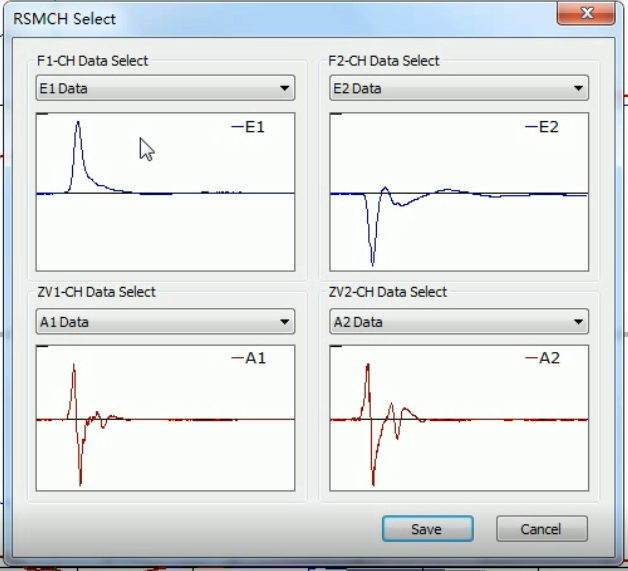
2. Click the function switch and select Case Analysis. Select the available waveforms (all selected by default) and click OK. (When the data collected by one channel is not good, you can uncheck it. Make sure that at least one of the force curve and the velocity curve has good data collecte.
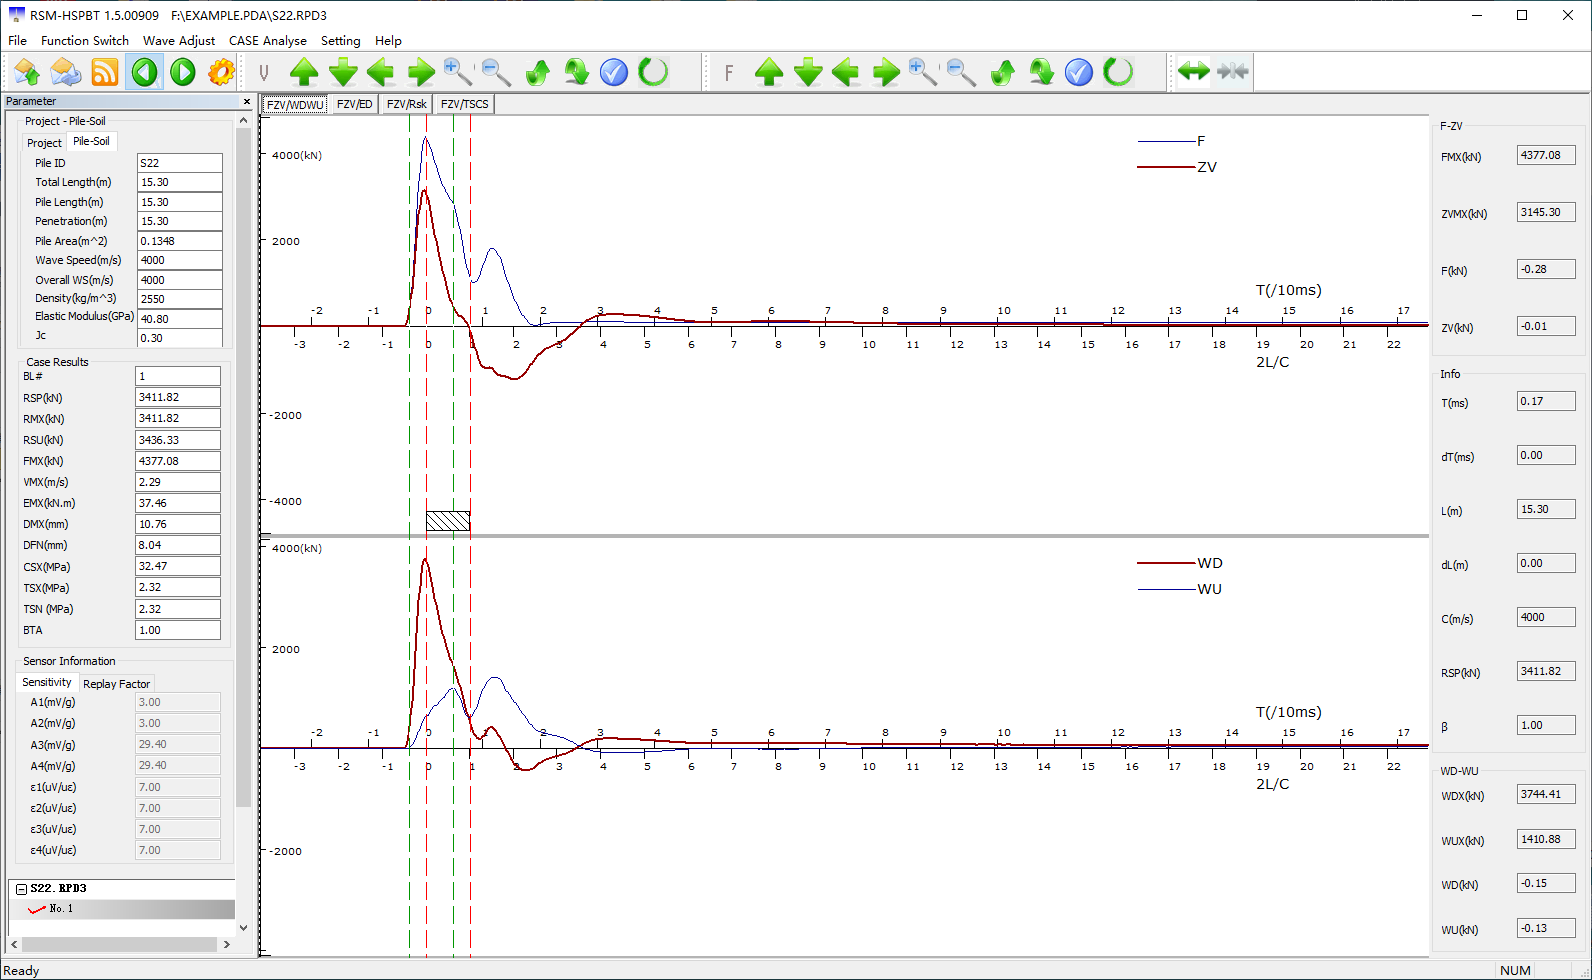
3. Determine the position of the pile head and pile bottom, as shown in the figure. (Left mouse click to select location, right mouse click to determine location category).
4. Output report. Click File - Report Output. Check the parameter options required by the report. If there are no special requirements, it can be defaulted and output to word. (The computer must have genuine office software installed).
RSMWAP software analysis operation steps
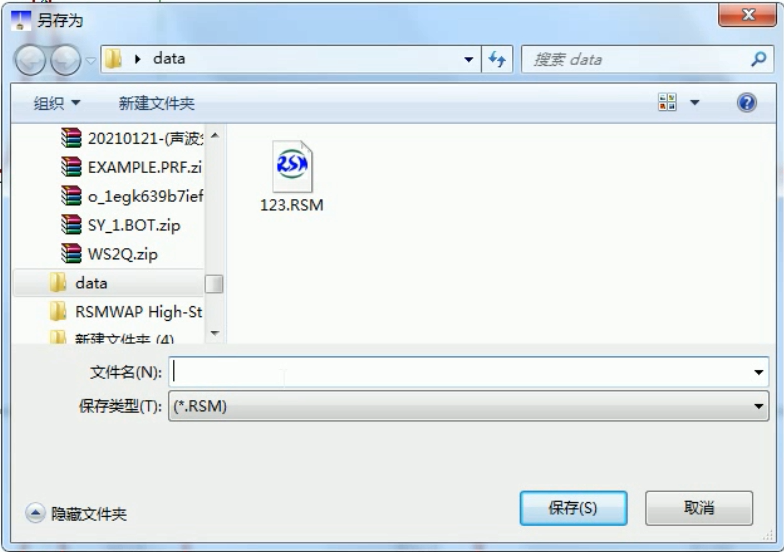
1. Open the RSM high-strain CASE analysis software, click File, and open the waveform file. Click File - Save As, the following box will pop up. Click Save. The resulting file has a .rsm extension.
2. Plug the superdog into the computer. Open the RSMWAP fitting software. File—Open the waveform file, find the .rsm data file you just saved, and open it.
3. Use the mouse to place the vertical lines on the pile head and the pile bottom respectively, and click the right button to determine the position of the pile head and the pile bottom.
4. Switch to the pile-soil information interface, and input the soil resistance of the pile side and the pile end respectively according to the information of the geological survey data, and the other parameters can be defaulted.
5. Switch to the RSMWAP analysis interface, keep other information as default, click Fitting Settings, and then perform automatic fitting, click OK after the fitting is completed, and the fitted bearing capacity result can be obtained. As shown. (Note: The fitted data must ensure that the pulse peak of the F curve is above the ZV curve, otherwise it cannot be fitted)
6. Click File - Report Output - Output to Word. Analysis ends.


